
Managing your SaaS sales or revenue operations with HubSpot? Struggling to build the right sales and revenue reports to accurately monitor your ARR or MRR figures? You’ve come to the right place. This blog post outlines how you can stay on top of your key recurring revenue metrics with HubSpot and Dear Lucy dashboards - even if you’re using the free HubSpot CRM.
As a Certified HubSpot App Partner focused on delivering the best-in-class sales and revenue reporting solutions, we want to develop Dear Lucy’s solution to meet the needs of the sales leaders within the HubSpot ecosystem. Monitoring recurring revenue with HubSpot has been one of the key wishes.
So here’s how to track recurring revenue with HubSpot and Dear Lucy dashboards.
Recurring and Non-Recurring Revenues
Having the ability to monitor and forecast the Annual Recurring Revenue (ARR) or Monthly Recurring Revenue (MRR) is at the heart of all SaaS businesses.
Many SaaS companies have both recurring revenue streams and “non-recurring” revenue streams. The customer deals include both recurring SaaS license fees (subscription revenues) and one-off implementation or onboarding fees (service revenues).
Having the ability to monitor, visualize and report on both of these revenue streams is crucial to truly understand the business and where it’s headed.
Today, many companies use excel spreadsheets or various BI tools to analyze data provided by the CRM, payment platforms, or financial systems, and to calculate revenue ratios and KPIs.
Keeping track of ARR/MRR growth with HubSpot and Dear Lucy is a faster and more immediate indicator of growth compared to tracking recurring revenues only through financial systems that are typically somewhat delayed.
Quickly growing SaaS scale-ups need robust reporting capabilities and many investors even urge companies to invest in user-friendly, real-time reporting early enough in their growth journey.
Real-time, visual reporting solutions help to keep the entire team focused on the right growth levers and to satisfy the data needs of the CEO, the board, and the investors.
What Data Do You Need to Track Recurring Revenue with HubSpot?
Calculating the recurring revenue metrics is quite straightforward. Dear Lucy pulls raw deal data from HubSpot and calculates a comprehensive set of sales and revenue metrics from that.
All you need is the following data on your deals in HubSpot CRM or HubSpot Sales:
Contract start date
Contract end date
Recurring revenue value (€/$ or any other currency you’re using)
HubSpot provides its own recurring revenue features that you can utilize to record this data but as those are only available with the more expensive HubSpot plans, your team may not have access to them.
With Dear Lucy, you can continue to use whichever plan you currently have and add the required deal properties to your HubSpot as custom properties to collect the required data.
Dear Lucy Recurring Revenue Dashboards for HubSpot
To view the entire set of ARR and MRR metrics that Dear Lucy can provide for HubSpot, you can explore our live demo.
Here’s a detailed breakdown of the most popular charts:
1 Monthly overview of total MRR development
This overview chart illustrates your existing MRR base, new MRR gained that month, and any possible lost MRR (churn) in one view. The chart also displays the figures for the last year as well as a target for the ongoing year.

2 MRR / ARR Growth
Monthly overview of your recurring revenue growth rate - either MRR or ARR, depending on which you have chosen to follow. The chart shows the current year and compares the growth % to the same period last year.

3 Churn rate%
An overview of the churn rate % either by
value of deals or
number of deals
Clicking on the overview opens a table that displays your month-to-month MRR figures and the churn rate for each month.


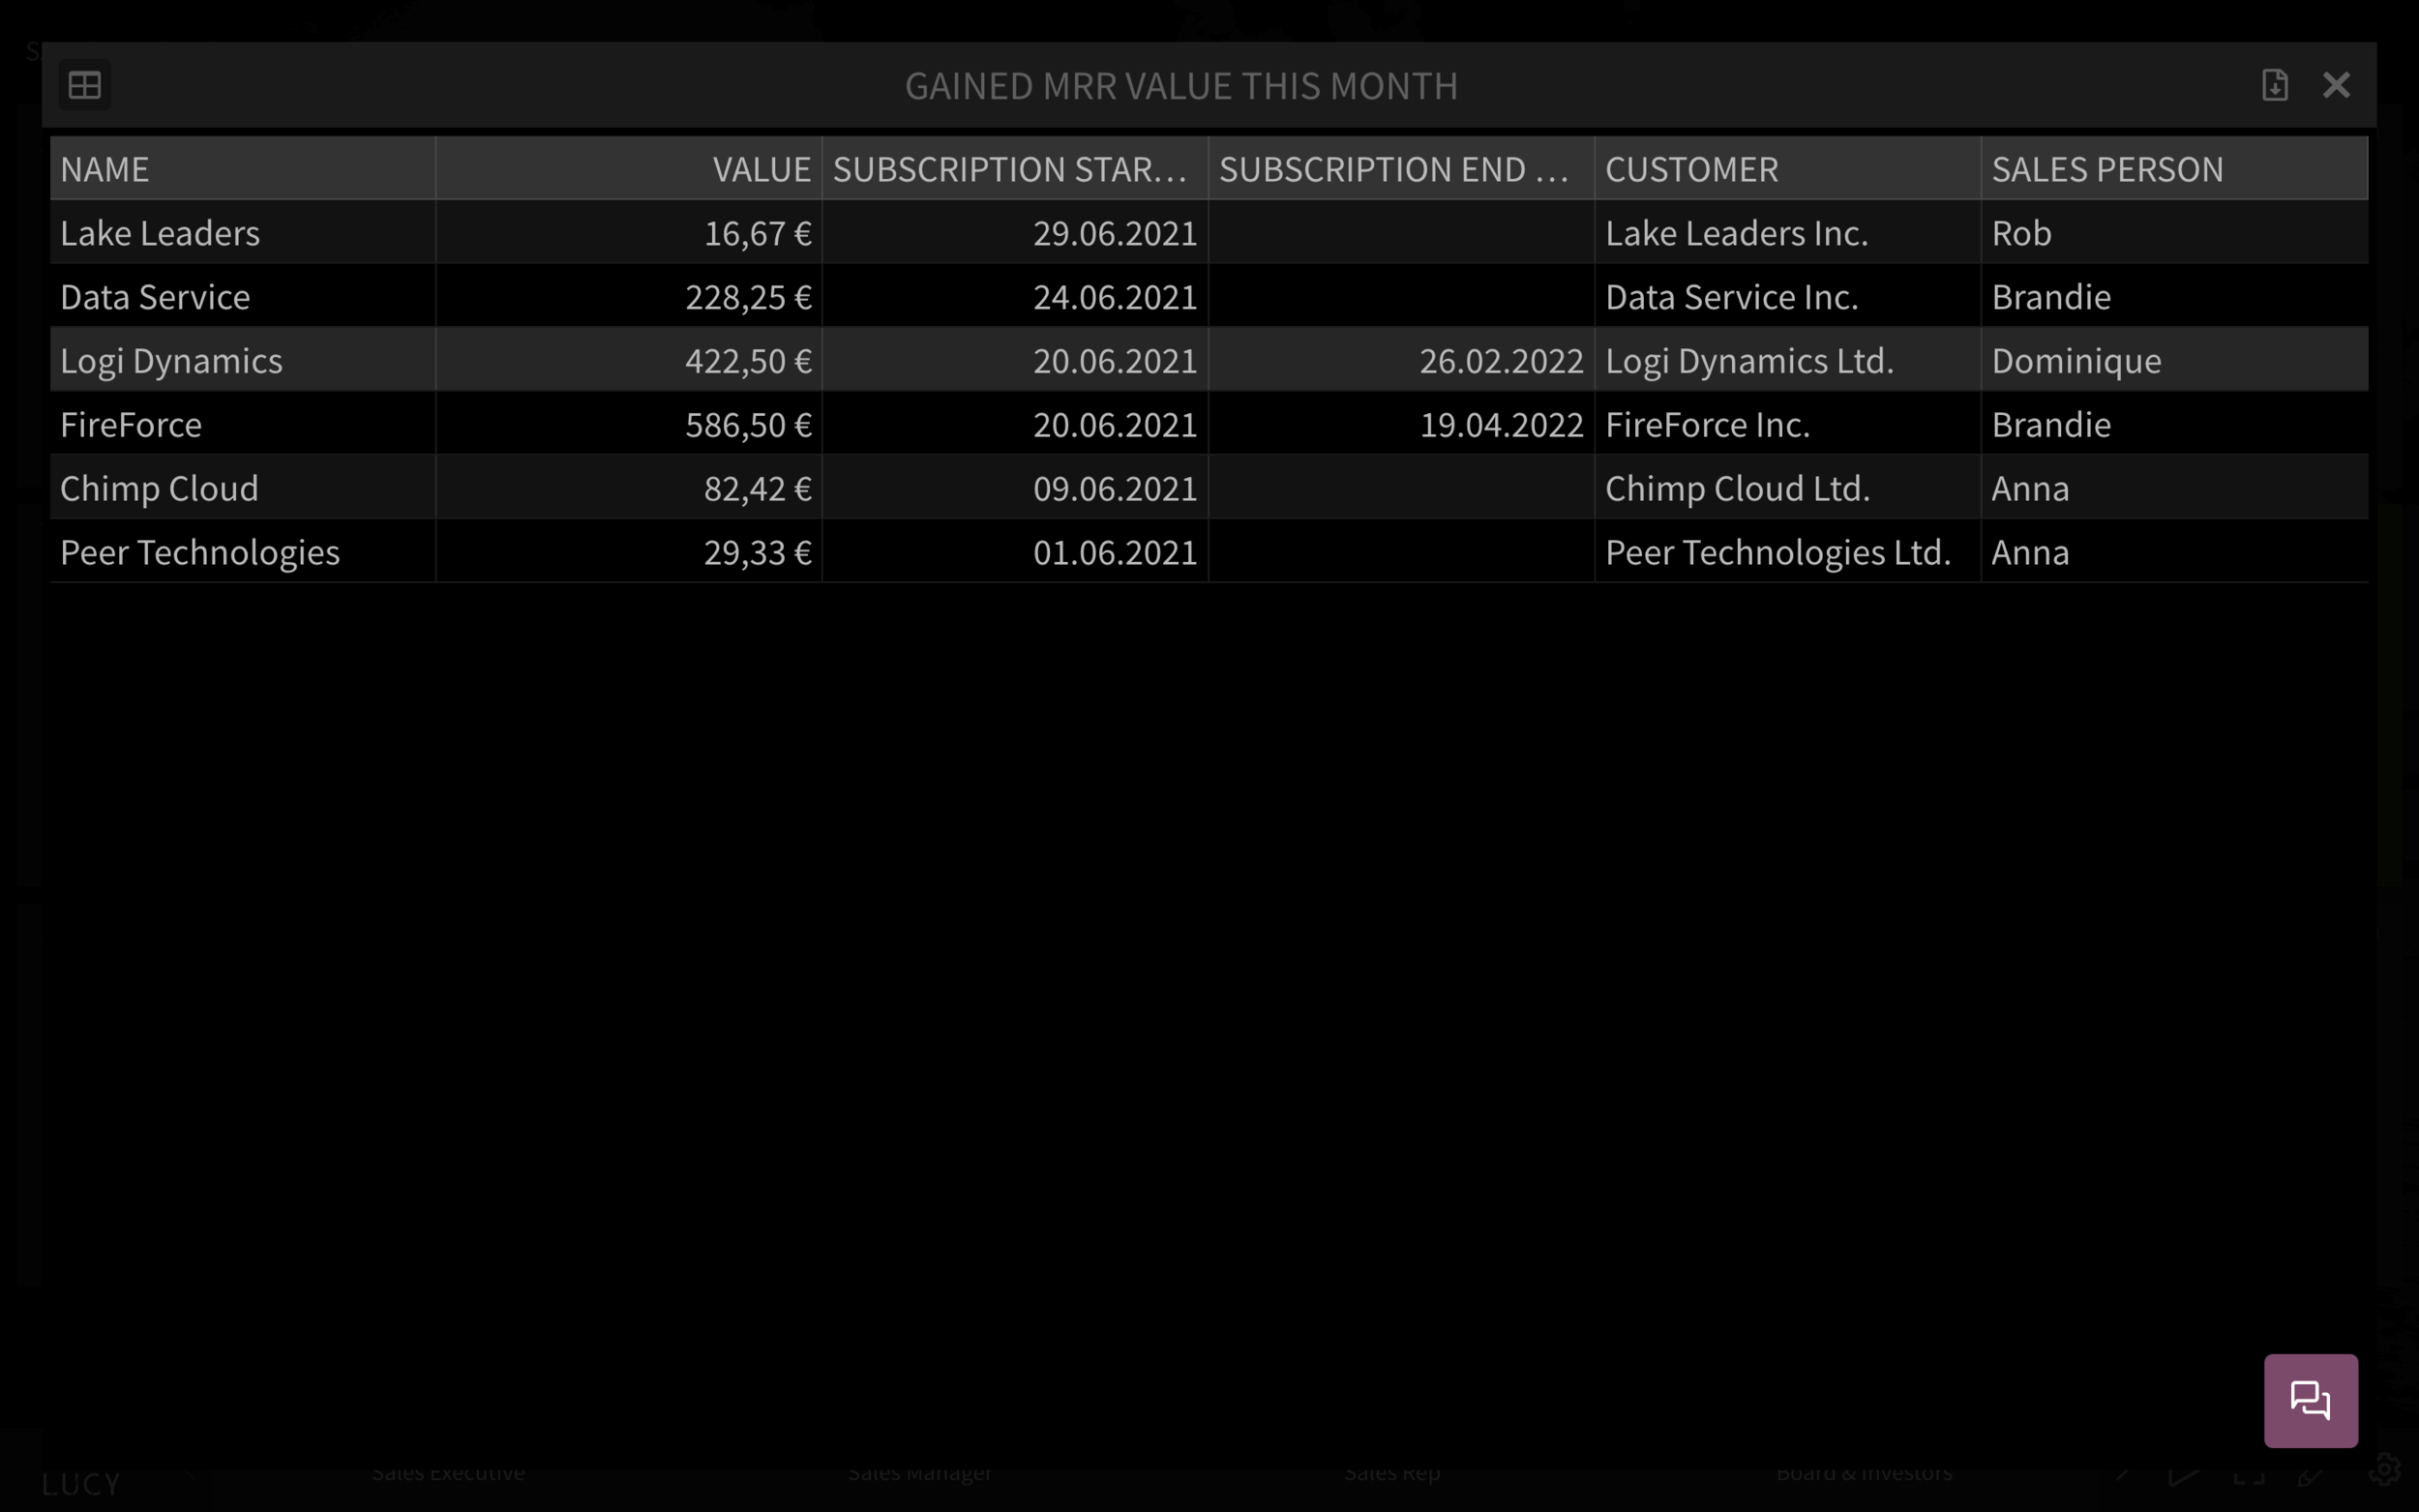
4 Gained MRR this month, Lost MRR this month
Overview numeric tiles that display the key MRR values for the ongoing month, the previous month, and a target if you’ve inputted one in Dear Lucy.
Clicking on the overviews of Gained MRR and Lost MRR displays a table view that displays the actual won and lost deals as a sortable list.

5 Forecast for the upcoming months & quarters
Dear Lucy also calculates a forecast for the upcoming quarters or months - either based on total contract values (including both recurring and non-recurring revenue items) or recurring revenues only.
Dear Lucy provides several forecasting models. The most common ones are a forecast based on the weighted pipeline probabilities or a forecast based on sales activities.

Monitor Real-time Performance Against Sales and Revenue Targets
One of the key features of Dear Lucy is our powerful “goal engine” that allows you to define targets for any sales metrics that you track with Dear Lucy - not just quota.
The same goes for all the recurring revenue metrics. With Dear Lucy, you can define targets for e.g.
New MRR per month, quarter, or year
MRR or ARR growth % (year-over-year or month-over-month)
Churn %
The targets can be defined on a company level or broken down by sales pipelines, products, business areas, or sales reps.
If you expect seasonal fluctuations in your business, you can define a different target for each quarter, month, or even a week.
Dear Lucy compares the real-time performance (pulled hourly from HubSpot) against the defined targets and displays with red and green indicators where your team is on target and where you are still behind.
This provides a crystal clear overview of your entire business and makes sure you always know which target to chase next.
Report Recurring Revenue from HubSpot to Your CEO and Board
Dear Lucy sales and revenue dashboards for HubSpot allow you to share the key sales and revenue data out of HubSpot easily and securely across the company.
All our plans give you access to unlimited dashboard users and unlimited views, so you can create relevant dashboard views for all relevant groups that you would like to keep informed about your progress.
So depending on your needs, you can use Dear Lucy to generate sales dashboards for
Weekly and monthly team meetings
Regular business area meetings
Top management and C-level meetings
Board and investor meetings
Quarterly Business Reviews
One-on-one performance review meetings between sales managers and their reps
Dear Lucy sales dashboards are responsive and browser-based so you can
use the live sales dashboards during meetings
invite team members to access Dear Lucy sales dashboards on their own so they can find the key sales and revenue data whenever the need arises
Use Dear Lucy on your mobile phone to check your key numbers wherever you are
Put up the most important sales and recurring revenue KPIs on the office info screens or TVs so everyone in the team can see your progress
Embed Dear Lucy sales dashboards on any internal websites or collaboration tools that allow embedding of external content
Embed Dear Lucy Dashboards to HubSpot Dashboards
If your HubSpot plan includes embedding external content to your HubSpot dashboards, you can embed Dear Lucy’s sales and revenue dashboards directly into HubSpot.
This allows your HubSpot users to see the selected company KPIs and targets without logging into Dear Lucy.
To embed Dear Lucy sales dashboards into a HubSpot dashboard, follow these steps:
Create a kiosk link in Dear Lucy of the dashboard(s) you’d like to show up in HubSpot
Make sure you have allowed embedding of the dashboards in Dear Lucy settings
Copy the kiosk link URL from Dear Lucy
Go to your selected HubSpot dashboard and choose “Actions” —> Embed External content
Paste the previously copied URL to the pop-up.
Resize the dashboard windows to your liking
You can use the interactive Dear Lucy dashboard just as you would use it on a browser window: You can click on the charts, view the drill-down tables, and switch between the dashboards.
Interested?
Dear Lucy offers a comprehensive set of sales and revenue metrics and forecasting tools for HubSpot. You can select your favorite KPIs and charts from the library of 150+ ready-made metrics, bring in custom properties from HubSpot or have our team build custom metrics just for you.
Book a session with our expert to learn more!